爱然喜欢你------保证金(第24周) |

| |
|
'╱◥███◣
︱田︱ 田 田| ╬╬╬╬╬╬╬ |
|
| |
| |
|
'╱◥███◣
︱田︱ 田 田| ╬╬╬╬╬╬╬ |
|
| |
| |
|
凡事相信 凡事包容 永不止息
|
|
| |
| |
|
凡事相信 凡事包容 永不止息
|
|
| |
|
凡事相信 凡事包容 永不止息
|
|

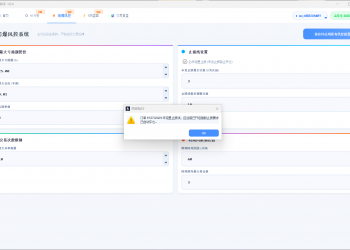 爆仓熔断,风险管控,避免雪崩烧“屋”1390 人气#黄金外汇论坛
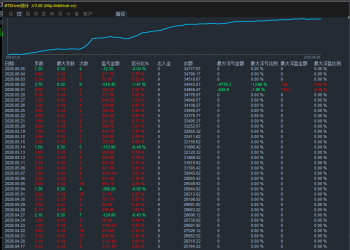 黄金五限策略1359 人气#黄金外汇论坛
 MT5精确控制图表显示:如何一屏固定显示1002047 人气#黄金外汇论坛
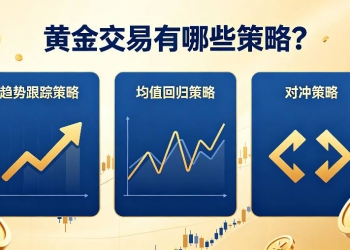 黄金交易有哪些策略?2026年多空拉锯下的实2214 人气#黄金外汇论坛
投诉/建议联系
微信/QQ:771081939

|Archiver|手机版 Mobile Version|关于我们 About Us|联系我们 Contact Us
Copyright © 2026 金股汇论坛(Y2论坛) 版权所有 Powered by Discuz! X3.5


 显身卡
显身卡


 微信微信
微信微信 官方微博
官方微博