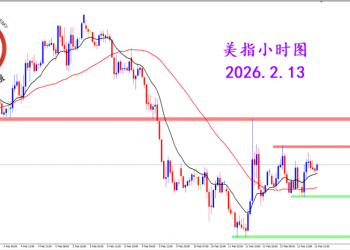
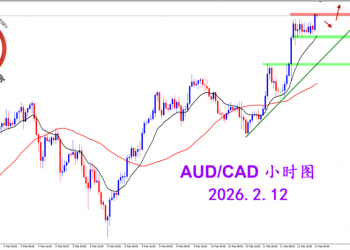
| |  | | Look at hourly chart, another top bearish divergence, in addition to the possible form of head and shoulder shape with the head at 1.0830, has been spotted from KD (9,3,3) indicator, [D = 63.44 corresponding prive level 1.0810 at 1:00pm on 4/10/03 (US East daylight saving time), while D = 78.99 corresponding to 1.0760 at the last hour 5:00pm on 4/11/03 (same as above without any other indication)].
A bearish divergence (11:00pm on 4/08/03 to 5:00am on 4/9) led to a sharp drop from 1.0770 level to 1.0670 level immediately, the next one (5:00am on 4/9 to 1:00pm on 4/10/03) led to the drop from 1.0830 to 1.0690 within the 22 hours.
You know what will happen to the latest one, don't you?
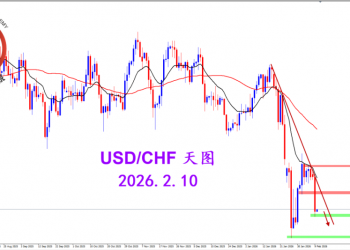
In addition, the dayly chart has a signal of forming a failure swing at top on RSI (14 - period time frame), now it moved to 49.70, as continues to move down to 45.67, the selling point, I guess you should do something to reward your time in the family. (Chart used from www.fxcm.com - free versions, the second one with using S&P date)
good luck
Sorry to use E, the software suggested by 晴空万里 does not work well on my machine yet. |  |  |  |  |
|