11 - 10 - 08 Euro/Usd (short term) |
回复 12楼 的帖子
| |
|
make money and make fun
|
|

 2026正规现货黄金交易平台有哪些?最新合规306 人气#黄金外汇论坛
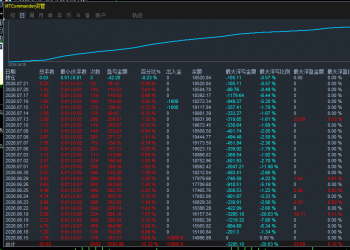 【逃跑计划】超级黄金版323 人气#黄金外汇论坛
 黄金M5周期一次一单EA|稳单风控238 人气#美股论坛
 奖池总价值20万美元,金荣中国2026年第二季408 人气#黄金外汇论坛
投诉/建议联系
微信/QQ:771081939

|Archiver|手机版 Mobile Version|关于我们 About Us|联系我们 Contact Us
Copyright © 2026 金股汇论坛(Y2论坛) 版权所有 Powered by Discuz! X3.5


 学习了~ 谢谢老师~
 显身卡
显身卡
 微信微信
微信微信 官方微博
官方微博