Non-farm payrolls preview: By the numbers
By Adam Button || November 1, 2012 at 17:52 GMT
|| 6 comments || Add comment
Here are some of the numbers to consider ahead of tomorrow’s non-farm payrolls report. Release time is 8:30 am ET.
Median estimate 125K (125K private as well)
Sept reading: 114K
High est 168K
Low est 30K
NFP 6-month avg 106K
Unemployment rate est. at 7.9% vs 7.8% prior
ADP 125K vs 114K prior (135K exp)
ISM manufacturing employment 52.1 vs 54.7 prior
ISM non-manufacturing employment: to be released Nov 5
Challenger job cuts 48K vs 34K in Sept, five month high
TrimTabs estimate based withheld income and employment taxes 140K
Monster Oct employment index: to be released Nov 2
Consumer Confidence jobs-hard-to-get: 39.4 vs 40.7 prior
Philly Fed employment: -10.7 vs -7.3 prior
Chicago PMI employment: 50.3 vs 52.0 prior
Initial jobless claims 4-wk moving avg: 367K vs 375K at the time of the Sept jobs report
Conference Board’s Help Wanted OnLine (HWOL) Index: -77.8K to 4736K
Aug JOLTS job openings: 3561 vs 3735 exp
My favorite pre-NFP indicator is the employment component of the ISM non-manufacturing index. Unfortunately, this month it won’t be released until Monday.
One thing that might point to a better number is the 342K reading in initial jobless claims in early October. Although it seems to have been a bureaucratic error, the low number came during non-farm payrolls survey week.
If you want to make your prediction, you can win a ForexLive.com t shirt. if you want my prediction: the political spinsters will earning their salaries tomorrow. |


 GPT5.5全新大模型优化金融分析领域,以实现1099 人气#黄金外汇论坛
 爆仓熔断,风险管控,避免雪崩烧“屋”2044 人气#黄金外汇论坛
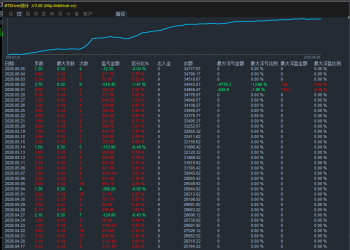 黄金五限策略2000 人气#黄金外汇论坛
 MT5精确控制图表显示:如何一屏固定显示1002633 人气#黄金外汇论坛


 显身卡
显身卡


 微信微信
微信微信 官方微博
官方微博