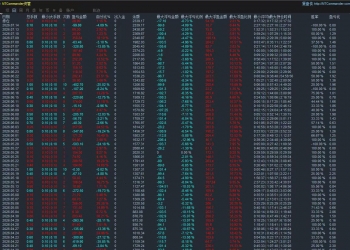
 | |  | | There are several likehoods discussed in posts of last week.
Price from 1.2384 intending to develop a diagonal triangle moving pattern with expanding variety is still the most likehood as soon as 1.2449 holds.
In this case, you may expect that current falling from 11/13/08 high 1.2855 could stop nearby 1.2500, then price goes up to challenge downside trend line again.
As the downside trend line has broken, price upside moving is likely to reach nearby 1.3100, even nearby 1.3200.
After the end of this upside moving, it is expected that price will fall again toward 1.2327/33 bottom, likely to see new low within 1.2200 zone.
If price moves against the bias above, i.e. breaking 1.2449 first, one could consider that price is developing a contracting variety diagonal triangle moving pattern started from 1.3296, in which
1.3296 --- 1.2525 would be wave 5 - i;
1.2525 --- 1.3117 would be wave 5 - ii;
1.3117 -- 1.2384 would be wave 5 - iii;
1.2384 -- 1.2855 would be wave 5 - iv; and
1.2855 would be the start of wave 5 -- v.
reference attached chart
Short term:
1) buy euro 1.2500/40 with stop loss below 1.2449, target 1.3050/1.3100; or nearby 1.3200;
2) sell euro at 1.3050/1.3100, or nearby 1.3200, set stop loss best to reference US Dollar below 83.87, target 1.2300/50, or nearby 1.2200
[ 本帖最后由 sharkeater 于 2008-11-17 03:37 编辑 ] |  |  |  |  |
|